Are You Really Diversified?
Trading View
10/8/25
The Long-Term Correlation of Portfolios and Real Estate to the S&P 500
For decades, the S&P 500 Index has been the central benchmark for measuring stock market performance and, by extension, the health of the U.S. economy. Because it represents roughly 80% of total U.S. market capitalization and includes 500 of the largest companies across all major industries, it captures the collective behavior of corporate America and global investor sentiment. But what’s often overlooked is that most investment portfolios - no matter how diversified they appear on the surface - tend to move in lockstep with the S&P 500 over long periods.
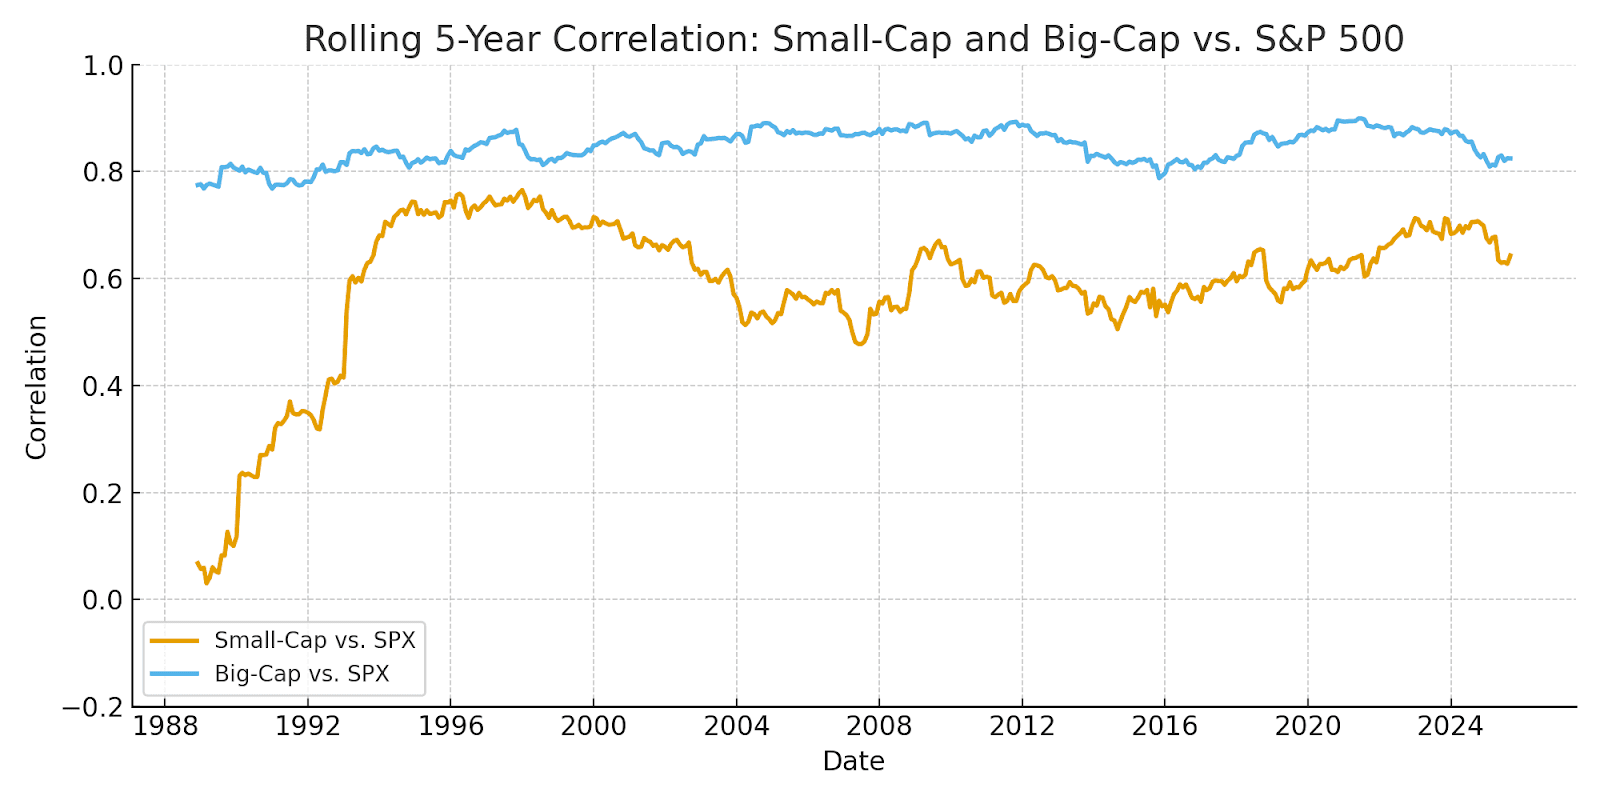
The Hidden Correlation in “Diversified” Portfolios
Academic and empirical research consistently shows that most equity-based portfolios maintain a long-term correlation with the S&P 500 of between 0.80 and 0.90. Large-cap stocks, as expected, exhibit a very high positive correlation. However, small-cap stocks also tend to move in the same direction - often more than investors realize. Whether it’s an actively managed mutual fund, an ETF, or an international equity fund, the underlying drivers of returns - economic growth, corporate earnings, inflation expectations, and investor risk appetite - are largely the same.
In the short run, portfolio styles may appear to diverge. For example, growth stocks might lead during periods of low interest rates. However, over five- and ten-year rolling windows, those differences tend to wash out. When macroeconomic tides shift - such as a broad expansion or recession - most stocks rise or fall together.
During the 2008 financial crisis and 2020 pandemic shock overall correlations increased. During both periods, correlations across nearly all equity categories spiked as systemic risk dominated individual fundamentals. Similarly, in liquidity-driven bull markets, enthusiasm for risk assets causes nearly all portfolios to climb together. What looks like diversification on paper - different styles, regions, or market caps - often collapses into a single market exposure when it matters most.
Real Estate’s Increasing Correlation to the Stock Market
Historically, real estate behaved more independently of equities. Local economic conditions, demographics, and credit cycles once determined property values far more than the stock market. Yet, over the past 25 years, that independence has steadily eroded.
The financialization of real estate - through real estate investment trusts (REITs), mortgage-backed securities, and institutional investment vehicles - has linked property markets to financial market dynamics. As a result, real estate prices increasingly respond to the same macro factors that drive the S&P 500: interest rates, liquidity, and investor confidence.
Data from indices like the Case-Shiller Home Price Index and the NCREIF Property Index show that the long-term correlation between U.S. property prices and the S&P 500 now averages 0.40 to 0.50, compared to near zero in the 1980s and early 1990s. For listed REITs, the correlation is even higher - typically near 0.70 - since they trade daily and react quickly to capital flows and monetary policy.
In essence, the rise of real estate as an asset class within diversified portfolios has paradoxically reduced diversification benefits. When stocks fall sharply, as they did in 2008 or early 2020, liquidity constraints and tighter credit conditions often lead to declines in real estate as well. Conversely, when equity markets soar, easy monetary conditions and wealth effects tend to boost property values. Over time, both assets are driven by the same global financial forces.
Time Horizon Diversification: The Overlooked Dimension
While most traditional asset classes have grown more correlated, time horizon diversification - diversifying by timeframe rather than asset type - offers a meaningful alternative. This is particularly evident in the S&P 500 itself.
Long-term investors often focus on multi-year returns, while short-term traders operate on timeframes of days, hours, or even minutes. Interestingly, studies of intraday and short-term trading models on the S&P 500 futures market show that short-term trading returns have very low or even negative correlation to long-term equity returns. In other words, the day-to-day or week-to-week price swings that short-term traders exploit are largely independent of the market’s decade-long growth trend.
This happens because short-term price action is dominated by liquidity imbalances, market microstructure, and algorithmic flows - factors that have little to do with earnings growth or macro fundamentals. Over a long horizon, however, returns are shaped by productivity, corporate profitability, and monetary conditions.
For instance, during a sustained bull market in the S&P 500, many short-term trend-following or mean-reversion strategies may profit equally well - or even outperform - because they capture local volatility rather than long-term direction. When viewed statistically, these short-term trading results show correlations near zero with the broader S&P 500 return profile over years or decades.
This means that for investors or funds seeking genuine diversification, adding strategies that operate on different time horizons - rather than simply adding more “different” asset classes - can meaningfully reduce portfolio risk. A portfolio that combines long-term index exposure with independent, short-term trading strategies achieves a more robust diversification than one that merely mixes equities and real estate.
Conclusion: The Illusion of Diversification
In today’s globalized, interconnected markets, most traditional investments - stocks, bonds, and real estate - are ultimately driven by the same forces of growth, liquidity, and central bank policy. The result is that long-term correlations to the S&P 500 are higher than ever.
True diversification requires more than just owning multiple asset types; it demands exposure to different sources of return - whether across time horizons, risk premia, or trading methodologies. For modern investors, the key question isn’t what assets you own, but how and when those assets generate returns. Without that distinction, the sense of diversification may be comforting - but it’s often an illusion.
by Peter Levant, MBA, MSc Finance, Managing Director, Index Research LLC
Special Reports
/
Smart market insights
Want us to cover a specific topic?
Whether it’s a sector, company, or macro theme you'd like to see explored — tell us. We continuously refine our research based on member input.