Intraday Volume and Volatility Smile in the S&P 500
Strategic Perspective
8/27/25
The Intraday Volume and Volatility Smile in the S&P 500 Index
Intraday trading in the U.S. stock market - particularly in the S&P 500 Index ($SPX) and its futures contracts (ES/MES) - follows a consistent and predictable rhythm. Market activity typically peaks at the open (9:30 AM ET), tapers off through the midday lull, and then surges again into the closing auction (4:00 PM ET). This recurring pattern, widely known as the volume and volatility smile, reflects the structural mechanics of modern equity markets and has significant implications for trade execution, risk management, and strategy design.
Understanding this dynamic is not just academic; it is essential for optimizing trade execution, managing risk, and designing trading strategies that align with the natural liquidity cycles of the S&P 500.
The Anatomy of the Volume Smile
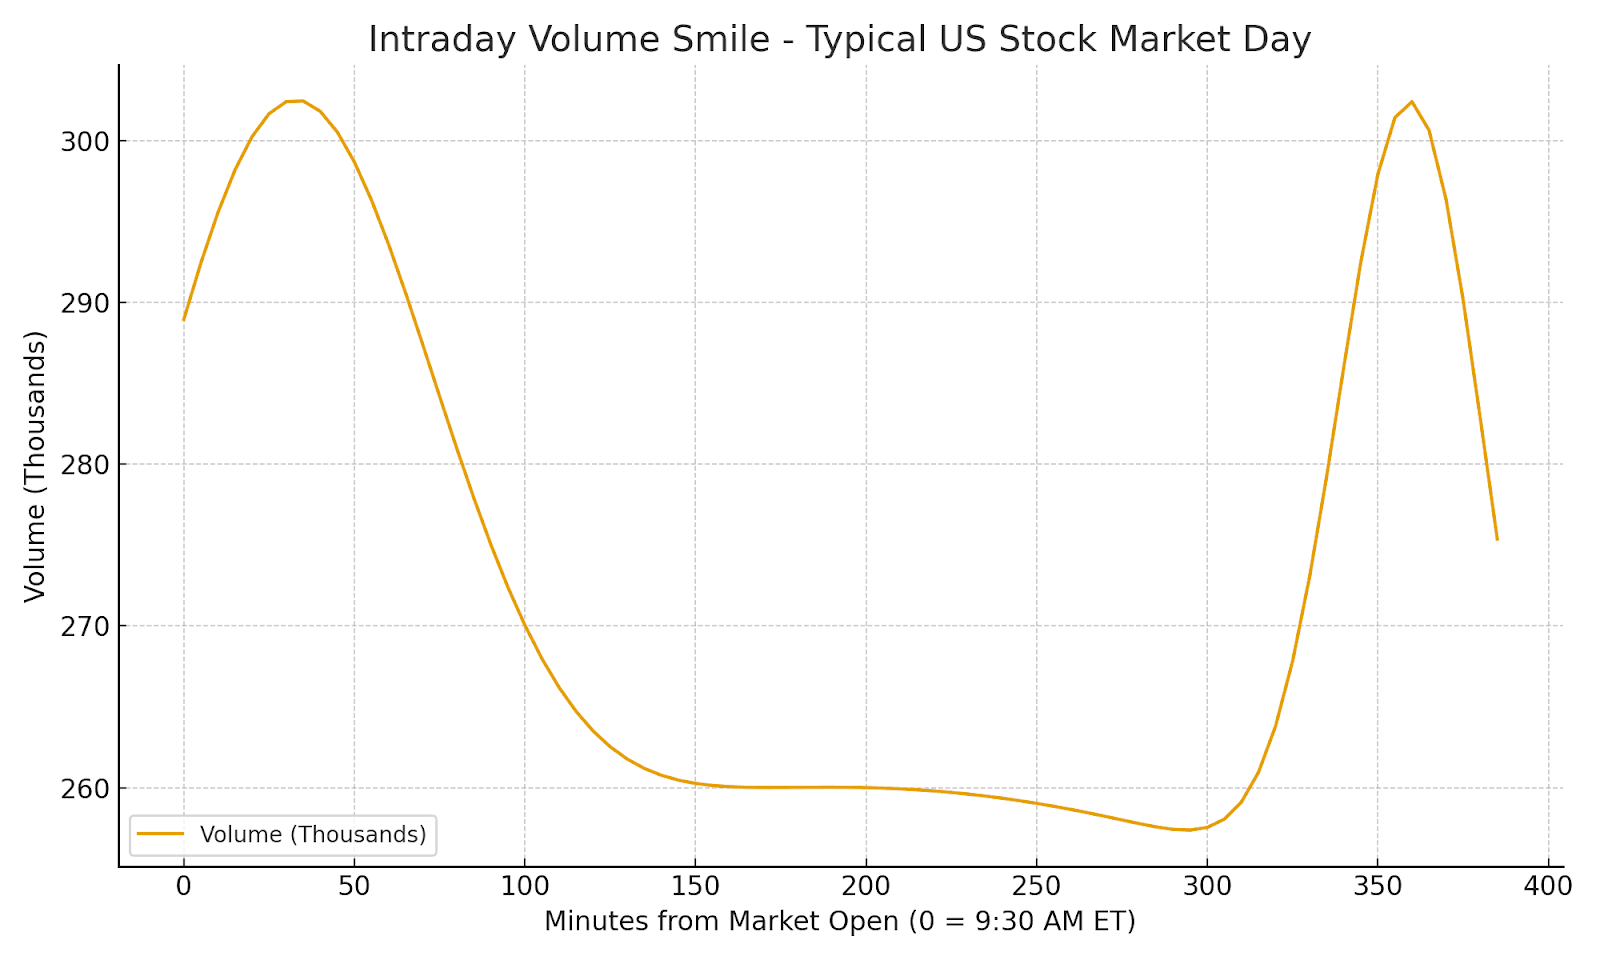
For the S&P 500 index and its derivatives, trading volume forms a U-shaped curve throughout the day. The pattern is visible in cash equities, index futures (ES/MES), and the SPY ETF.
Opening Burst (9:30 AM - 10:30 AM)
The first hour of trading is a period of intense activity. Overnight news, pre-market orders, and ETF arbitrage flows converge to create deep liquidity pools. Institutional desks rebalance positions, and market makers adjust quotes, while high-frequency traders execute arbitrage strategies across related products.
For S&P 500 traders, the open often provides the best opportunity for efficient execution, as the surge in liquidity reduces slippage and tightens bid-ask spreads. Price discovery is rapid, and volatility provides directional opportunities for intraday traders.
Midday Lull (11:30 AM - 2:00 PM)
As the morning rush subsides, volume naturally declines. Many institutional participants step back, and algorithmic execution slows. This lull often leads to wider spreads and thinner liquidity, making large trades more expensive in terms of market impact.
For many intraday traders, this period is either a time to avoid new trades or to carefully manage positions established during the morning. The S&P 500 often enters a consolidation phase, and price action can become choppy with lower volatility.
Closing Ramp (3:00 PM - 4:00 PM)
In the final hour, activity surges again. Mutual funds, ETFs, and institutional portfolio managers execute rebalancing trades and market-on-close orders. The closing auction often represents 7-10% of daily S&P 500 volume, and on index rebalancing or options-expiration days, that figure can be even higher.
For traders, the closing session provides another window of deep liquidity and meaningful price discovery. Algorithms designed to match or outperform VWAP often concentrate activity in this period.
The Volatility Smile
Intraday Volatility Smile - Volatility mirrors trading volume in the S&P 500 index.
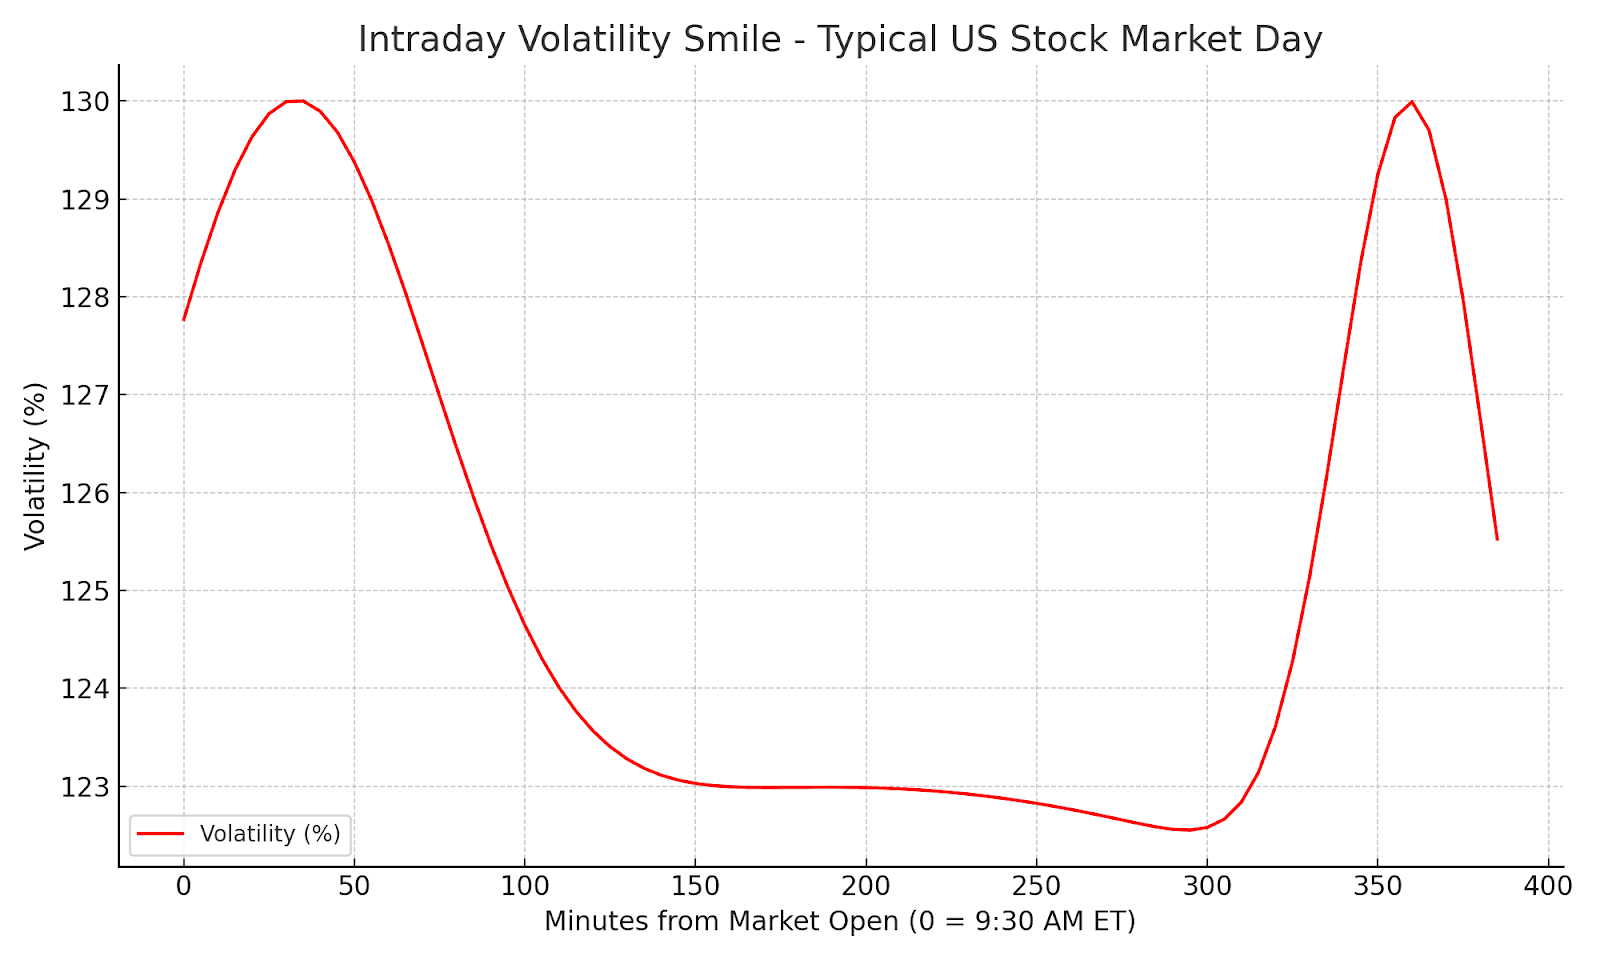
Just as trading volume follows a U-shaped curve, intraday volatility in the S&P 500 mirrors this pattern. The volatility smile is driven by the same structural factors that create the volume curve: order imbalances, information flow, and liquidity conditions.
High volatility at the open stems from the market digesting overnight news, economic data, and corporate developments.
Low volatility midday corresponds to reduced order flow and calmer market conditions.
Renewed volatility near the close reflects portfolio adjustments and aggressive execution of market-on-close orders.
For active traders, this volatility structure creates clear opportunity zones. Scalpers and momentum traders focus on the opening and closing windows, while swing traders may prefer the midday calm to position for the next wave of activity.
Why the Smile Matters for S&P 500 Traders
1. Liquidity and Execution Efficiency
For institutional traders and active investors, liquidity is a critical determinant of execution quality. Trading during periods of deep liquidity—the open and close—allows for:
Narrower bid-ask spreads in SPX options, ES futures, and SPY ETF shares.
Reduced slippage for large trades.
Improved tracking error management for passive and benchmarked strategies.
2. Price Discovery
The S&P 500 is the primary barometer of U.S. equity sentiment, and price discovery is most efficient during the open and close.
The open incorporates overnight developments and sets the tone for the day.
The close reflects cumulative information and positions the market for the next session.
3. Risk and Volatility Management
Understanding the volatility smile allows traders to adjust position sizing, stop placement, and hedging activity based on predictable intraday volatility. Early and late sessions may require wider stops but also offer the best momentum and directional opportunities.
4. Strategy Design
Execution algorithms like VWAP and TWAP are often calibrated to the volume smile, front-loading or back-loading activity to align with periods of highest liquidity. Short-term mean-reversion and breakout strategies often use these windows for entries and exits.
Factors Amplifying the Smile in the S&P 500
Certain conditions can exaggerate the intraday volume and volatility patterns:
Economic data releases (e.g., Non-Farm Payrolls, CPI, GDP) often trigger sharp moves at the open.
Earnings announcements, especially from mega-cap S&P 500 constituents, lead to heightened volatility and directional flows.
Options expiration and index rebalancing days see dramatic spikes in both volume and volatility, particularly into the close.
End-of-quarter adjustments amplify closing auction activity as funds rebalance to maintain target weightings.
Practical Applications for Traders and Investors
For Active Day Traders:
The first and last hours of trading - often referred to as “power hours” - are prime windows for capturing short-term momentum. By aligning entries and exits with high-liquidity periods, traders can minimize slippage and take advantage of deeper order books.
For Institutional Desks:
Execution quality is critical for institutions managing billions of dollars. By skewing participation toward the open and close, desks can match or outperform benchmarks like VWAP while reducing adverse market impact.
For Risk Managers:
Understanding the intraday volatility cycle helps in planning hedging activity. Adjusting exposure near periods of heightened liquidity reduces execution costs and improves hedge efficiency.
For Algorithmic Strategies:
Algorithmic strategies can dynamically adjust execution profiles to reflect intraday liquidity and volatility shifts. For example, a VWAP algo may increase its participation rate during the open and close while throttling back during the midday lull.
Historical and Structural Drivers
The volume and volatility smile is not new; it has been a feature of U.S. equity markets for decades. However, structural shifts have amplified its effects:
- The rise of passive investing and ETF flows has concentrated activity around benchmark prices.
- The growth of algorithmic trading has made execution patterns more predictable.
- Regulatory changes and the rise of dark pools have altered intraday liquidity distribution, but the overall U-shaped profile has persisted.
Conclusion
The volume and volatility smile in the S&P 500 index is more than a curiosity; it is a critical structural feature of the world’s most liquid equity market. By understanding and adapting to this pattern, traders and investors can:
- Optimize trade execution.
- Improve risk-adjusted returns.
- Design strategies that align with predictable liquidity cycles.
Whether you are an institutional desk executing billion-dollar portfolios or an active trader managing a smaller account, recognizing and leveraging this intraday rhythm can transform a structural pattern into a strategic edge.
by Peter Levant, MBA, MSc Finance, Managing Director, Index Research LLC
Special Reports
/
Smart market insights
Want us to cover a specific topic?
Whether it’s a sector, company, or macro theme you'd like to see explored — tell us. We continuously refine our research based on member input.