Opening Gaps in the S&P 500 Cash Market: A Leading Indicator for Daily Trading Ranges
Trading View
9/25/25
The Opening Gap
In financial markets, few patterns draw as much attention as the opening gap. Each morning when the S&P 500 cash market opens, traders immediately notice whether the index starts the day above or below the prior day’s close. Some see gaps as short-term opportunities - wondering whether they will “fill” and at what pace. Others treat them as noise in an otherwise efficient market. But our research suggests that opening gaps are much more than a curiosity. They typically serve as a leading indicator for the day's trading conditions.
By studying the day session open of the S&P 500 cash index during 2022, 2023, 2024, and year-to-date 2025, we found a consistent relationship between the presence of an opening gap and the size of the daily trading range. Put simply:
Days without significant gaps (less than 0.20% of the index) tend to produce narrower trading ranges.
Days with gaps of 0.20% or more reliably generate wider daily trading ranges.
This distinction matters because the daily range - defined as the high minus the low - is a key driver of intraday opportunity. And unlike most market indicators, this one is available to every trader right at the open.
Defining the Terms
Before diving deeper, let’s be precise about the definitions we will use:
Gap: The difference between the opening price of the S&P 500 cash index and the prior day’s closing price.
Significant gap: For our backtest, we set the threshold at 0.20% (20 basis points) or more. This is large enough to rule out a lot of market noise, but not so large as to exclude frequent, tradable events.
Daily range: The day’s high minus the day’s low. This is the raw measure of intraday movement and a core element of risk and opportunity for traders.
Our dataset covered four consecutive years - 2022, 2023, 2024, and the current year through 2025 YTD. This period includes both bullish and bearish phases, high- and low-volatility regimes, and multiple Federal Reserve rate-cycle shifts. That variety makes the findings more robust.
The Backtest Results
The results of our backtest were clear. On days with no significant gap, < 0.20%, the S&P 500’s intraday range was generally less, on average 1.04%. Volatility was more contained and price action more orderly.
But when the market opened with a gap of 0.20% or greater, the character of the day changed. Daily ranges expanded meaningfully to an average of 1.38%. Traders disagreed about valuation, supply and demand imbalances surfaced, and intraday volatility was markedly higher.
This was true across all years tested (total 933 days). While the absolute size of daily ranges varied depending on the broader volatility environment (2022’s inflation shock looked different than 2023’s post-hike drift), the relationship between opening gaps and larger ranges remained consistent. See table below with the results of the backtest.
Header 1 | no gap | gap |
|---|---|---|
Daily Trading Range (%) | ||
min | 0.16% | 0.25% |
max | 3.96% | 9.77% |
average | 1.04% | 1.38% |
Total days (#) | ||
933 (2022 – today) | 385 | 548 |
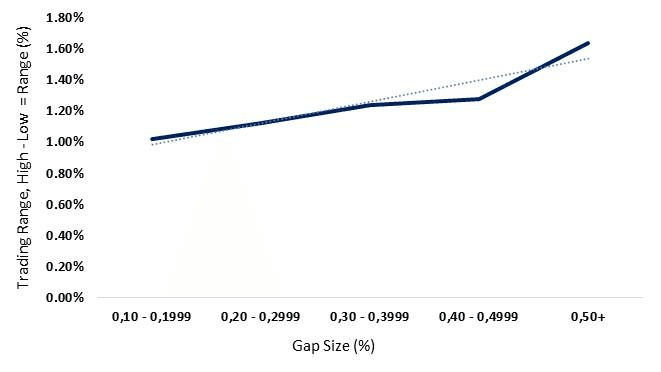
The bigger the Gap, the bigger the Trading Range
After the results of the backtest, we decided to dig a little deeper into different gap sizes and the corresponding daily trading ranges (averages). As expected, the bigger the gap, the bigger the trading range.
See table and chart below.
Why This Matters
For active traders, the importance of this finding is straightforward: opening gaps provide actionable, leading information. Most indicators in trading are either lagging or coincidental. By the time you identify them, the opportunity may already have passed. But a gap is visible the instant the market opens. It offers a “heads-up” that today’s price action is likely to be wider, more volatile, and potentially more rewarding (or more dangerous, depending on your positioning).
This knowledge can help traders calibrate their approach:
Position sizing: On gap days, expect larger moves and consider adjusting exposure accordingly.
Stop placement: Wider ranges suggest giving trades more room or using volatility-adjusted risk measures.
Strategy selection: Mean-reversion strategies may thrive in tight ranges, while breakout or trend-following strategies often benefit from gap-driven volatility.
Beyond “Will It Fill?”
Most gap analysis focuses narrowly on whether the gap will “fill” - that is, whether the price returns to the prior close during the same day. This is a valuable framework; gap fills are tradable events with definable probabilities. But our research takes a broader perspective.
A gap is not just an isolated anomaly. It is a repricing event. It signals that, overnight, market participants digested new information - economic data, earnings reports, geopolitical news, or simply a shift in sentiment - and came to a different conclusion about price.
This shift creates disagreement between buyers and sellers. And that disagreement plays out in the form of wider trading ranges. Whether the gap fills or extends, the market is telling us that something has changed.
Examples from Recent Years
A few real-world examples illustrate the point:
2022 - Inflation and Fed tightening: Gaps often appeared following CPI releases or hawkish Fed commentary. These sessions were marked by sharp, two-sided ranges as traders battled over the inflation outlook.
2023 - Post-hike drift: In calmer stretches, gaps were smaller, and ranges compressed. But when a gap exceeded 0.20%, even in a quieter environment, it tended to spark active sessions.
2024 - AI-driven rallies and geopolitical shocks: Big overnight moves in mega-cap tech stocks frequently produced gaps in the index. These days were characterized by heavy volume and strong directional ranges.
2025 YTD - Rate-cut cycle and election headlines: Gap days have once again been synonymous with volatility, as traders digest the evolving macro and political picture.
Across all these conditions, the link between opening gaps and daily ranges held.
Practical Uses for Traders
The insight that gaps lead to wider trading ranges can be put to work in multiple ways:
Morning Preparation: Traders can adjust expectations right at the open. A no-gap day? Expect quieter conditions. A significant gap? Prepare for larger intraday swings.
Volatility Forecasting: Options traders, in particular, can use this information to anticipate intraday realized volatility relative to implied.
Strategy Filters: Systematic traders may include gap conditions as filters in their models. For example, a breakout system might only engage on days when a gap suggests higher ranges.
Risk Management: Portfolio managers can adapt intraday risk limits depending on whether the day is likely to be range-expanding or range-contracting.
A Holistic View of Gaps
It is worth emphasizing that gaps are not inherently bullish or bearish. They are contextual. Sometimes a gap up will be filled, other times it will continue. The direction is case-specific.
But what is consistent is the effect on range. A gap means the market has been repriced, and traders disagree about the implications. That disagreement generates activity, volatility, and price movement.
In other words, gaps are less about predicting where the market will go, and more about predicting how much it is likely to move. For traders, that distinction is crucial.
Conclusion
Our backtest of S&P 500 cash market sessions from 2022 through 2025 confirms a simple but powerful insight: opening gaps are leading indicators of daily trading ranges.
Small or no gap? Expect quieter sessions with contained ranges.
Significant gap (0.20% or more)? Expect wider ranges, higher volatility, and more active opportunities.
This is information traders can use immediately at the open. While many participants fixate on gap fills, a broader perspective reveals that gaps themselves are signs of repricing and disagreement - conditions that reliably produce larger ranges.
For anyone trading the S&P 500, whether through futures, ETFs, options or other derivatives, recognizing this relationship can improve preparation, sharpen strategy selection, and enhance risk management.
In today’s fast-moving financial markets, reliable leading indicators are scarce. One of the few is the opening gap.
by Peter Levant, MBA, MSc Finance, Managing Director, Index Research LLC
Special Reports
/
Smart market insights
Want us to cover a specific topic?
Whether it’s a sector, company, or macro theme you'd like to see explored — tell us. We continuously refine our research based on member input.