Weekly Newletter #52
Ads
Testing Support and Bouncing Back
The past trading week, from Monday November 3 to Friday November 7, proved pivotal for the S&P 500 Index (SPX). After several weeks of sideways volatility and narrowing leadership, the index finally retreated to test its intermediate-term trend line - the 50-day moving average (MA) - before staging a notable reversal. As of Thursday, November 6, the SPX closed at 6,720.32, a level that placed it below its 5-, 10-, 15-, and 20-day MAs. For short-term trend followers, that alignment served as a technical warning: when multiple moving averages turn lower in sequence, momentum systems read it as a potential transition from bullish to corrective phase.
On Friday November 7, the index opened with a gap lower amid risk-off sentiment and continued weakness in technology shares. The selling pressure initially pushed the SPX close to its 50-day MA, then sitting near 6,665.75 - a technical price level which is closely watched by institutional allocators and systematic macro funds. However, after testing that support, the market reversed sharply higher in what traders described as a “V-shaped” intraday pattern. By the closing bell, much of the morning’s losses had been erased. That resilient reversal set the stage for what futures traders were already signaling ahead of the new week: a sizable gap-up open on Monday November 10, implying that the near-term trend might have flipped back upward.
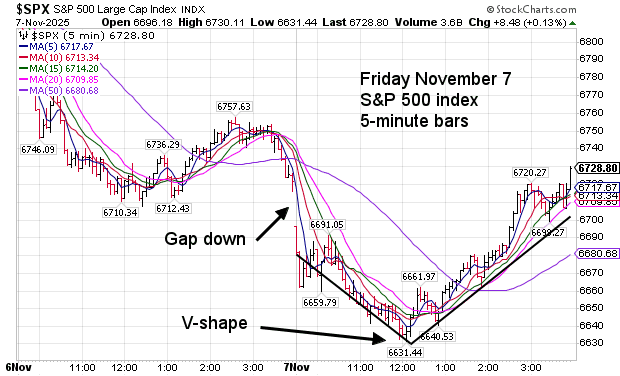
chart courtesy of stockcharts.com
Fed Policy and Interest-Rate Outlook
Throughout the week, investor focus remained on the Federal Reserve’s interest-rate trajectory. The central bank’s most recent policy meeting reaffirmed a data-dependent stance, emphasizing that additional easing in December was “possible but not assured.” Fed Chair Jerome Powell noted that while inflation metrics continue to cool, the Committee seeks “sustained evidence” before committing to further rate cuts. Futures markets now price in roughly a 70% probability of a 25-basis-point reduction at the December FOMC meeting, down from about 90% just two weeks ago.
This subtle recalibration matters for equities. With the policy rate near the late-cycle peak of the current tightening-easing cycle, traders are weighing the trade-off between stable disinflation and slower growth. Equity valuations remain elevated, particularly in the technology sector, so even small shifts in rate expectations ripple through risk assets. Yet the recent stabilization in Treasury yields - the 10-year note hovering un the area of 4% - has provided breathing room for equity bulls and supported the argument that the broader bull market remains intact, at least for now.
Government Shutdown: A Cloud Over Confidence
Adding to the uncertainty, the ongoing U.S. government shutdown has disrupted the release of key economic indicators, leaving policymakers and markets partially in the dark. With several federal agencies temporarily closed and data pipelines paused, investors lack timely readings on employment, retail sales, and manufacturing sentiment. The absence of data complicates the Fed’s “data-dependent” approach and adds an extra layer of speculation ahead of December’s policy meeting.
Nevertheless, the political tone in Washington appeared to soften late in the week. Reports of constructive negotiations between congressional leaders and the White House helped lift market sentiment on Friday afternoon. By Monday’s pre-market session, optimism that the shutdown could end soon was cited as one factor behind the upbeat tone in S&P 500 futures, which traded significantly higher before the cash market open.
Seasonality: A Tailwind into Year-End
Seasonality now begins to assert itself. Historically, November and December are among the most constructive months for U.S. equities. Over the past 50 years, the S&P 500 has posted positive returns in roughly two-thirds of Novembers and nearly three-quarters of Decembers, buoyed by post-earnings positioning, year-end portfolio rebalancing, and the so-called “Santa Claus rally.”
While seasonality is never guaranteed, it often influences trading psychology. With volatility easing and bond yields stabilizing, many institutional investors seek to defend or improve annual performance metrics before year-end. That seasonal pattern, combined with the SPX’s rebound from its 50-day MA, could encourage incremental buying pressure - particularly from systematic funds whose models have flipped back to neutral or modestly long after last week’s recovery.
Technical View: Short-Term Trend Turns Up
From a technical standpoint, the Friday–Monday reversal sequence marks an important inflection. The market’s ability to hold above the 50-day MA and then gap higher in futures trading suggests renewed demand at key support. The 6,665–6,700 zone remains a critical pivot: sustained closes above that area would confirm a continuation of the medium-term uptrend, while a decisive break below would open the door to deeper correction potential toward 6,550.
Breadth indicators improved modestly on Friday, with advancing issues outpacing decliners by roughly two-to-one on the NYSE. Meanwhile, mega-cap technology stocks - including Nvidia, Tesla, Palantir, and Oracle - helped lead the late-week turnaround, reclaiming leadership after several sessions of profit-taking. That rotation underscores the market’s ongoing dependence on the tech sector for momentum, but also highlights investors’ willingness to re-enter high-beta names once selling pressure abates.
Outlook: Bull Market Still Intact
As of Monday morning November 10, before the U.S. session opens, S&P 500 futures indicate a large gap up, reinforcing the bullish tone that emerged Friday afternoon. The combination of resilient technical support, improving sentiment on Washington negotiations, and stable commodity prices has so far prevented a deeper correction.
The same risks remain - a protracted shutdown, uneven economic data, and uncertainty over the pace of Fed easing - but for now, investors have voted with their trades: the short-term trend is up, and the broader bull market remains intact.
Trading Perspective
My High-Time-Frame (HTF) model, which analyzes daily data, switched from SELL to BUY mode on Friday. The new uptrend is only one day old with moderate strength, following a four-day downtrend. The model continues to trade on both sides of the market - long and short - using short-term trend-following and gap-specific strategies.
Low-Time-Frame (LTF):
BUY: 2-, 5-, or 15-minute bars triggered by upward 5/20 SMA crossovers, followed by an SMA bounce. Bar size is determined by volatility and the prevailing trading range.
SELL: 2-, 5-, or 15-minute bars triggered by downward 5/20 SMA crossovers, followed by an SMA bounce. Bar size is determined by volatility and the prevailing trading range.
by Peter B. Levant, MBA, MSc Finance, Managing Director, Index Research LLC
Weekly Reports
/
Smart market insights
Want us to cover a specific topic?
Whether it’s a sector, company, or macro theme you'd like to see explored — tell us. We continuously refine our research based on member input.