Weekly Newletter #53
Ads
S&P 500 Suffers Pullback as Fed Signals Split and Liquidity Tightens
A turbulent week marked by Fed uncertainty, Big Tech dispersion, liquidity concerns, and elevated volatility
The trading week of November 17 to 21, 2025, stood out as one of the most volatile stretches for U.S. equities in recent months. From large gap openings to sharp intraday reversals, traders faced an unusually unstable landscape. Short-term trend models using daily data confirmed that the S&P 500 remains in a short-term downtrend, and by midweek the market’s internal tone had deteriorated significantly.
Thursday’s losses capped the index’s largest slide since August, with the S&P 500 falling nearly 5% from its recent high to the mid-week low. The breakdown reflected a combination of macro uncertainty, tightening liquidity, weakening leadership from Big Tech, and inconsistent policy signals. Only Friday brought meaningful stabilization, helping the index avoid a much more damaging week. When the dust settled, the S&P 500 index closed down -1.94% for the week.
Fed Outlook: Rate-Cut Odds Collapse Early, Then Rebound After Miren’s Comments
The macro narrative sent mixed and sometimes contradictory signals throughout the week. Early on, the CME FedWatch showed the odds of a December 25-basis-point rate cut dropping to around 30%, reflecting growing concern that the Federal Reserve may push cuts further into 2026. This reduction in expected accommodation created immediate pressure on equities, especially in Growth and Tech.
Adding to this uncertainty, Bank of America delivered a notable call, stating that they do not expect any additional rate cuts under Fed Chair Jerome Powell. BofA’s economists argue that despite some recent softening, the labor market remains fundamentally tight - a dynamic reinforced by declining immigration-driven labor supply. They see limited scope for easing due to sticky inflation and project that the unemployment rate will remain near full-employment levels. As a result, their baseline view is that “there won’t be any more rate cuts under Chair Powell.”
Vanguard added its own caution, warning that Wall Street is pricing in too many rate cuts too quickly, even as massive AI-related spending continues to bolster U.S. economic momentum.
The tone shifted late in the week. On Friday, Federal Reserve Governor Stephen Miran surprised markets by saying on Bloomberg TV that he could support a 25-basis-point cut in December. Miran’s unexpectedly dovish stance helped soften the bearish tone and assisted the late-week rebound. However, the broader message remains fragmented within the Fed, leaving investors with more questions than answers. Policy uncertainty remains a dominant driver of day-to-day volatility.
NVIDIA Earnings: Strong Results and a Deepening AI Debate
NVIDIA remained at the center of market attention. The company posted another strong quarter Wednesday after the close, beating expectations on both revenue and earnings while providing positive forward guidance. The global build-out of AI infrastructure continues to fuel unprecedented demand for its high-performance GPUs. Reflecting this trend, Goldman Sachs and JPMorgan raised their NVDA price targets to $250, citing accelerating AI adoption and ongoing strength in compute requirements.
Yet the stock struggled to hold its gains. On Thursday, NVDA shares hit $196, but then dropped to $181. On Friday, NVIDIA stock closed at $178. Shares turned negative following comments by Ray Dalio, who warned that the AI-driven boom may be forming a bubble, and that investors should prepare for lower returns going forward. The fact that NVDA - the market’s flagship AI stock - faded after strong earnings underscored the fragility of risk appetite.
On the earnings call, Colette Kress, NVIDIA’s EVP and CFO, addressed one of the more controversial claims in recent months: Michael Burry’s argument that NVDA chips quickly become obsolete and that hyperscalers may be understating GPU depreciation. Kress disputed this directly, noting that NVIDIA chips remain operational and competitive for six years or more, thanks to continuous improvements to software stacks. She highlighted that major companies typically assign 5–6 years of useful life to advanced compute hardware, stating that Burry’s depreciation critique was unfounded.
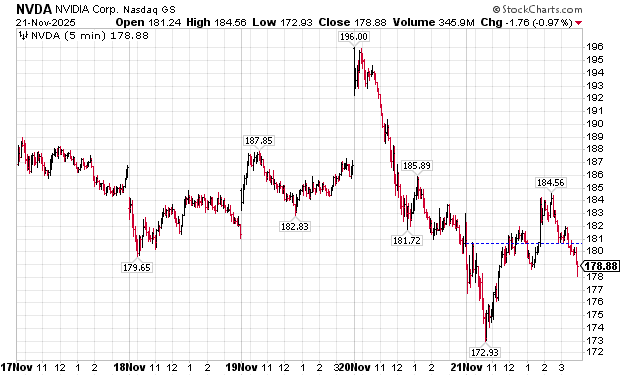
chart courtesy of stockcharts.com
Still, NVIDIA faces several critical risks and headwinds:
Market dominance concerns that could trigger regulatory scrutiny,
Government and policy pressure, especially on advanced chip exports,
Geopolitical sensitivity around sales to China,
Growing competition from AMD, Intel, and custom silicon developers.
Industry analysts also emphasize four key constraints that stand between NVDA and its full fair-value potential:
Ownership concentration - Heavy institutional ownership, 72.44% of float, and NVDA carrying an S&P 500 index top weighting.
Investments in unprofitable customers like OpenAI and Anthropic, which may take years to generate returns.
Physical data center constraints, including power, cooling, and land availability.
Limited operational leverage, given the company’s ongoing need for robust software and R&D investments.
Despite stellar earnings, the combination of bubble warnings, tight liquidity, and broader Tech weakness prevented NVDA from igniting a rally.
Bubble Signals: Dalio and Howell Raise Red Flags
Beyond NVIDIA, the broader macro mood was dampened by renewed warnings from prominent investors. Ray Dalio argued that elevated valuations, the intensity of the AI boom, and widening wealth gaps suggest that markets may be in a speculative bubble. He warned that investors should moderate their expectations and prepare for an environment where returns are structurally lower.
Liquidity expert Michael Howell, CEO of CrossBorder Capital, reinforced these concerns. He stated that global liquidity - the financial system’s essential fuel - is now drying up. In an interview on the MacroVoices podcast with Erik Townsend, Howell warned: “We’ve been in a bit of a bubble and liquidity is basically being pulled away.”
Howell believes that the speculative phase in U.S. equities has peaked and that markets may now be entering a two- to three-year downturn. These liquidity warnings gained traction throughout the week, especially as markets struggled to sustain rallies.
Thursday Breakdown: The Steepest Slide Since August
Thursday’s price action encapsulated the week’s instability. The S&P 500 opened with a large gap up, fueled by upbeat reactions to NVIDIA earnings and softer Treasury yields. Yet the rally was short-lived. Prices drifted in the early morning before reversing sharply and filling the entire opening gap. This type of intraday dynamic - gap-up followed by a full fade - typically reflects a market in a weaker stage of the trend cycle. It reinforced the short-term downtrend and contributed to the week’s overall deteriorating technical structure.
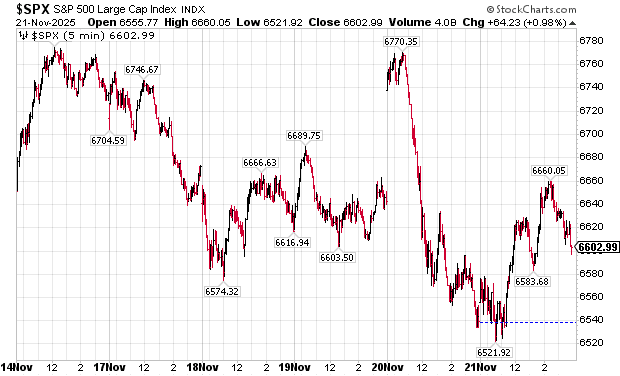
chart courtesy of stockcharts.com
Big Tech Dispersion: Fractured Leadership
A major theme this week was the continued dispersion within Big Tech, breaking from the synchronized leadership that defined much of the prior year.
Alphabet (GOOG): demonstrating relative strength.
Amazon, Meta, Tesla, Oracle: showing notable weakness, slipping into short-term downtrends.
Microsoft (MSFT): trading sideways; high $555, last $472.
NVIDIA (NVDA): high $212, last $178.
Palantir (PLTR): high $207, last $154.
Netflix (NFLX): high $134, last $104.
The fragmentation of leadership is meaningful. Tech is no longer moving as a unified block. Some names are stabilizing while others correct sharply. This type of dispersion often signals maturation or exhaustion of a broader market trend.
Investor Positioning: Cash at 3.7%
Bank of America’s November 2025 Fund Manager Survey showed institutional cash at 3.7%. With limited dry powder, the market has reduced incremental buying power. Historically, low cash levels are associated with softer forward returns, as investors are already fully positioned.
Friday Stabilization: Support at 6,500 Holds
After a week of turbulence, Friday brought some relief. The S&P 500 closed at 6,602.99, up +64.23 points (+0.98%). The rebound helped shore up losses and prevented the downtrend from accelerating. Crucially, the index held the 6,500 support level (trading as low as 6,521.92), offering a temporary pause in selling pressure.
However, according to a Bloomberg article by Natalie Kniazhevich, much of Friday’s bounce appeared to be short covering more than dip buying. The report noted that hedge funds “scrambled to cover short positions into the weekend,” fueling upside momentum. With next week being a holiday-shortened week - markets closed Thursday, Nov. 27, and early close Friday, Nov. 28 - traders will have only three full sessions (Mon–Wed) to adjust positioning after digesting this week’s volatility.
Conclusion: Market is at a Critical Turning Point
This week revealed several emerging risks:
declining expectations for near-term rate cuts,
tightening liquidity conditions,
bubble warnings from prominent investors,
AI valuation concerns,
fractured Big Tech leadership,
and low institutional cash reserves.
Friday’s stabilization prevented additional technical damage, but the market remains in a fragile short-term downtrend.
For long-term investors, the hope is that conditions stabilize and volatility recedes. For traders, the environment remains highly reactive - with rapid momentum shifts and compressed holding periods.
In summary, this was a turbulent and consequential week. The next several sessions will reveal whether the market is undergoing a temporary shakeout or the early stages of a deeper consolidation.
Trading Perspective
My High-Time-Frame (HTF) model, which analyzes daily data, is in SELL mode. The current downtrend is seven days old, and it has medium strength. The previous trend was an uptrend that only lasted three days. The model continues to trade on both sides of the market - long and short - using short-term trend-following and gap-specific strategies.
Low-Time-Frame (LTF):
SELL: 2-, 5-, or 15-minute bars triggered by downward 5/20 SMA crossovers, followed by an SMA bounce. Bar size is determined by volatility and the prevailing trading range.
BUY: 2-, 5-, or 15-minute bars triggered by upward 5/20 SMA crossovers, followed by an SMA bounce. Bar size is determined by volatility and the prevailing trading range.
by Peter B. Levant, MBA, MSc Finance, Managing Director, Index Research LLC
Weekly Reports
/
Smart market insights
Want us to cover a specific topic?
Whether it’s a sector, company, or macro theme you'd like to see explored — tell us. We continuously refine our research based on member input.