Weekly Newletter #54
Ads
Support Holds: A Constructive Week for the S&P 500
Last week delivered an important inflection point of the fourth quarter for the S&P 500. The prior week had brought the index straight into several key technical support levels - levels that, if broken, could have triggered a deeper correction and a meaningful shift in market psychology. Instead, those support zones held decisively. Selling pressure exhausted itself, buyers stepped in, and the S&P 500 established a short-term bottom. What followed was a constructive and resilient rally throughout the Thanksgiving holiday week, signaling that the market may have regained its footing after the recent wobble.
The recovery occurred against a backdrop of improving macro sentiment, strong performance in key asset classes, and a wave of upgraded S&P 500 price targets from major global banks. Taken together, these developments formed a powerful tailwind for markets and helped shift investor psychology back toward a more optimistic tone as December begins. The smart money’s tone changed: from cautious and defensive the week before to constructive and opportunistic this past week.
Technical Recap: Support Holds, Momentum Returns
Two weeks ago, the S&P 500 tested critical technical support - including the 50-day moving average and several shorter-term trend lines. Momentum models were weakening, volatility was rising, and the market appeared at risk of a deeper pullback. But rather than breaking lower, the index found support and reversed.
That reversal was technically meaningful for several reasons:
Failed breakdown: The index dipped below support intraday but reclaimed it into the close - a strong bullish reversal patterns in technical analysis.
Momentum recovery: Key short-term indicators, including RSI and MACD, turned up from near-oversold conditions.
Moving average reclaim: The S&P 500 climbed back above its 5-, 10-, 20-, and 50-day moving averages, a major technical improvement closely followed by both discretionary traders and systematic trend-following models.
These signals collectively marked the shift from a deteriorating trend to a rebuilding one. By the start of Thanksgiving week, buyers had regained control. While holiday liquidity was thin, the price action had conviction: the market drifted higher with limited profit-taking, suggesting that sellers had stepped aside.
Holiday weeks often produce exaggerated or misleading moves due to thin participation, but this time the upward drift reflected a genuine improvement in sentiment. The S&P 500’s behavior in a low-liquidity environment - firm, steady, and persistent - was itself a bullish signal.
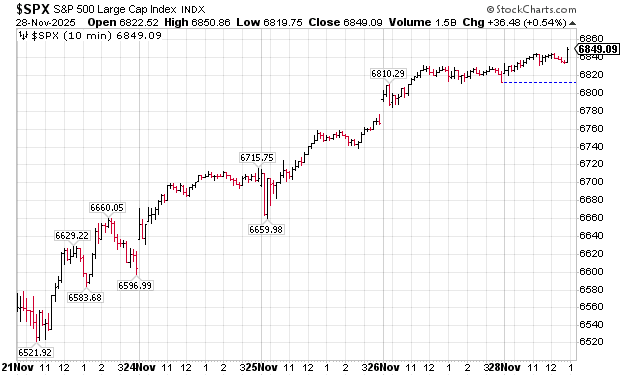
chart courtesy of stockcharts.com
Thanksgiving Week: A Resilient Rally in Thin Conditions
Despite a shortened trading schedule, the S&P 500 advanced throughout the Thanksgiving period. The resilience was notable because low-volume weeks typically produce choppy or directionless price action. Instead, equities climbed in a controlled, orderly fashion.
Investor psychology played a major role. The market’s successful defense of support the week prior shifted the mood from fear of breakdown to confidence in stabilization. Dip-buyers reappeared, traders were less willing to sell into strength, and the lack of negative macro headlines allowed equities to continue drifting upward with little resistance.
Seasonal factors also contributed. Historically, the final weeks of the year tend to generate positive returns as institutional investors adjust exposure, volatility softens, and year-end flows support risk assets. The combination of seasonal strength and technical stabilization created an ideal backdrop for last week’s move.
Wall Street Turns More Bullish: Major Banks Raise S&P 500 Targets
One of the week’s largest sentiment drivers came from Wall Street itself. Three major global banks - J.P. Morgan, Deutsche Bank, and Morgan Stanley - issued notable upgrades to their S&P 500 targets for 2026, reinforcing confidence in the multi-year structural bull market narrative.
J.P. Morgan: Base Case 7,500; Bull Case Above 8,000
J.P. Morgan raised its 2026 S&P 500 target to 7,500, outlining a bull-case scenario above 8,000 based on:
Expect Federal Reserve rate cuts in 2026
Stronger corporate earnings
AI-driven productivity gains
Sustained leadership from mega-cap tech
Deutsche Bank: Target Raised to 8,000
Deutsche Bank increased its target to 8,000, highlighting:
Continued U.S. GDP strength
Robust earnings
A multi-year AI investment cycle driving margin expansion
Morgan Stanley: Target Raised to 7,800
Morgan Stanley lifted its target to 7,800, emphasizing:
U.S. dominance in AI adoption
Stronger fundamentals compared to Europe and Asia
Healthy corporate balance sheets
These upgrades - arriving during a technically strong week - amplified market confidence.
Macro Highlights: Fed Expectations Shift Yet Again
One of the most significant developments this week was the sharp shift in expectations surrounding Federal Reserve policy. Strategists now view a December 2025 rate cut as highly likely, a sharp contrast to expectations just weeks ago.
According to CME Fed funds futures, markets are pricing in an 87% probability of a 25 basis point rate cut at the December meeting. Investors are back believing that the Federal Reserve will ease policy before year-end.
The re-pricing reflects:
Softer inflation data
Stable unemployment figures
Improving financial conditions
A desire by policymakers to support economic momentum heading into 2026
“What a difference a week makes” has become the defining phrase of the current macro narrative. A market that looked unsettled two weeks ago now views a dovish Fed as the base case.
Cross-Asset Strength: Gold Trades Higher
Gold delivered a solid week, extending what is shaping up to be one of the most significant precious metals rallies in modern history. On Friday, November 21, Gold was $4,061. By the end of last week, Gold had climbed to $4,216 per ounce, continuing gold’s extraordinary upward move.
Beyond the weekly move, gold’s year-to-date rally is exceptional: the metal has surged 60% in 2025, breaking decisively above the $4,000 level on October 8 - a milestone that might have seemed improbable one year ago.
A new Goldman Sachs survey, released this week, further highlights the intensity of the bullish sentiment around gold. Conducted between November 12 and 14 among more than 900 institutional investor clients via Goldman’s Marquee platform, the poll revealed:
36% of respondents (the largest single cohort) expect gold to exceed $5,000 per ounce by the end of 2026
33% expect gold to reach between $4,500 and $5,000
Only a small minority anticipate a meaningful pullback
Central bank accumulation has been a major driver of the metal’s unprecedented strength. Emerging-market reserve managers have been aggressively buying gold for diversification, currency hedging, and long-term stability. Meanwhile, broad investor appetite continues to increase as global economic risks - geopolitical tensions, fiscal deficits, and currency volatility - drive allocations toward tangible, non-fiat assets.
Gold’s rise alongside equities reflects a structural shift: investors now view gold not merely as a safe-haven hedge but as a core component of long-term portfolio construction. The combination of strong momentum, growing institutional demand, and a highly bullish long-term outlook sets the stage for further potential upside into 2026.
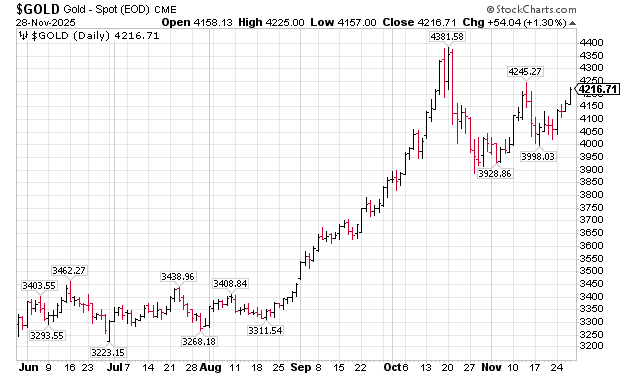
chart courtesy of stockcharts.com
Sector Highlights: Alphabet Breaks Out as NVIDIA Consolidates
One of the standout stories of the week came from Alphabet (GOOG). Shares hit a new all-time high. Heavy institutional buying and a powerful technical breakout pushed the stock into a new leadership role within mega-cap tech. Alphabet is increasingly being valued as a foundational AI infrastructure name, not merely an advertising company.
Meanwhile, NVIDIA (NVDA) continues to consolidate. NVDA closed at $177 on Friday, November 28, and after its earnings report a few weeks ago, the stock has been in a trading range between the mid-$170s and mid-$180s. This digestion phase reflects valuation recalibration after a massive year-to-date advance, as investors reassess near-term catalysts and supply-chain dynamics.
This rotation - selling NVIDIA and buying Alphabet - helped broaden leadership within the mega-cap landscape and reinforced market stability.
Alphabet shares hit a new all-time high.
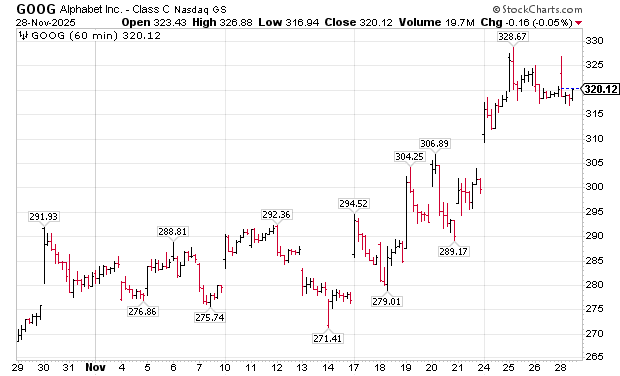
chart courtesy of stockcharts.com
Index Performance: Weekly, Monthly, and Year-to-Date Perspective
This week's rally produced strong S&P 500 benchmarks:
Weekly return: +3.71%
November return: +0.12%
Year-to-date gain:+16.43%
A flat November is a solid outcome given the volatility earlier in the month. A +16% YTD return places 2025 firmly within the category of historically strong performance years.
Looking Ahead: December Setup and Key Risks
As December begins, traders will focus on several key themes:
The December Fed meeting and rate-cut probabilities
The durability of the short-term uptrend
Sector and mega-cap leadership dynamics
Volatility normalization after the holiday period
Risks remain, but the improving technical backdrop, bullish institutional outlook, and strengthening macro signals support a cautiously optimistic stance.
Conclusion
This was a pivotal and constructive week for U.S. equities. Technical support held, momentum returned, and the S&P 500 rallied despite low-liquidity holiday conditions. A wave of bullish price-target upgrades from major banks, strengthening cross-asset signals - especially from gold - and the sharply rising odds of a December Fed rate cut (now 87%) combined to fuel a strong recovery. Alphabet’s breakout added leadership breadth, while NVIDIA’s consolidation signaled healthy rotation.
With a strong weekly gain, positive seasonal tailwinds, and improving macro conditions, the S&P 500 enters December on solid footing with renewed upside potential.
Trading Perspective
My High-Time-Frame (HTF) model, which analyzes daily data, is now in BUY mode. The current uptrend is four days old, and it has medium strength. The previous trend was a downtrend that lasted seven days. The model continues to trade on both sides of the market - long and short - using short-term trend-following and gap-specific strategies.
Low-Time-Frame (LTF):
BUY: 2-, 5-, or 15-minute bars triggered by upward 5/20 SMA crossovers, followed by an SMA bounce. Bar size is determined by volatility and the prevailing trading range.
SELL: 2-, 5-, or 15-minute bars triggered by downward 5/20 SMA crossovers, followed by an SMA bounce. Bar size is determined by volatility and the prevailing trading range.
by Peter B. Levant, MBA, MSc Finance, Managing Director, Index Research LLC
Weekly Reports
/
Smart market insights
Want us to cover a specific topic?
Whether it’s a sector, company, or macro theme you'd like to see explored — tell us. We continuously refine our research based on member input.