Weekly Newletter #42
Ads
S&P 500 Hits New All-Time High but backs off!
Last week’s chart for cash market S&P 500 index ($SPX)
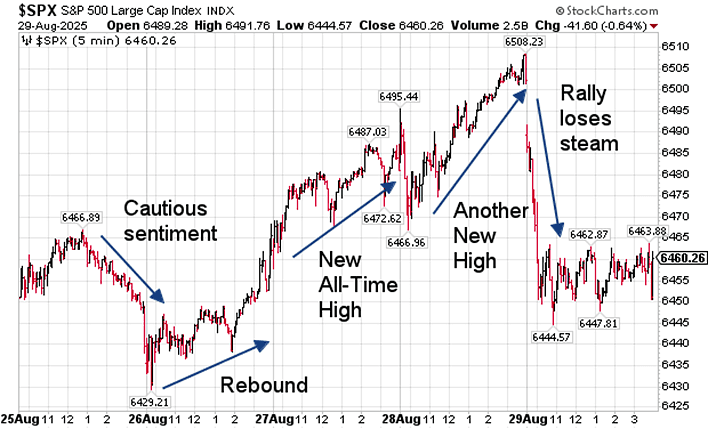
chart courtesy of StockCharts.com
The close on Friday begs the question: “Is this a market top?” It’s too early to say right now, but I will be looking for technical indicators, such as price crosses below key moving averages. As of the publication of this report, the short-term uptrend was still intact. Tuesday will be critical.
Here is how it played out!
Monday, August 25
On Monday, August 25, 2025, the S&P 500 slipped 0.4% to 6,439.32. The pullback followed Friday’s Powell-fueled rally as investors turned focus to Nvidia’s midweek earnings and slightly higher Treasury yields. The sentiment was cautious.
Tuesday, August 26
Markets rebounded mid-week as the S&P 500 rose 0.4 % (26.6 points), closing at 6,465.94, driven by strength in industrials, financials, and tech.
Wednesday, August 27
The index continued to climb, setting a new all-time high, buoyed by upbeat sentiment around Nvidia’s earnings and strong performance from software names. Companies such as Kohl’s and MongoDB reported strong results and raised outlooks.
Thursday, August 28
The S&P 500 again closed at record levels. Both the index and the Dow posted all-time highs on Thursday. In fact, the intraday peak reached 6,508.23, while the closing high stood at 6,501.86.
Friday, August 29
However, the rally lost some steam on Friday as tech stocks - including Nvidia and Broadcom - weighed on the market, pushing the S&P 500 slightly lower. The index retreated from its record territory as chip-sector weakness took its toll.
Weekly and August Month-End Performance
For the week, the S&P 500 index lost 6.65 points, nearly unchanged. For the full month of August 2025, the S&P 500 posted a positive return of approximately +1.90 %. This marks a fourth straight monthly gain – a notable streak amid macroeconomic headwinds like tariff tension and labor data softness.
The Index Drivers
Top 10 Heavyweights
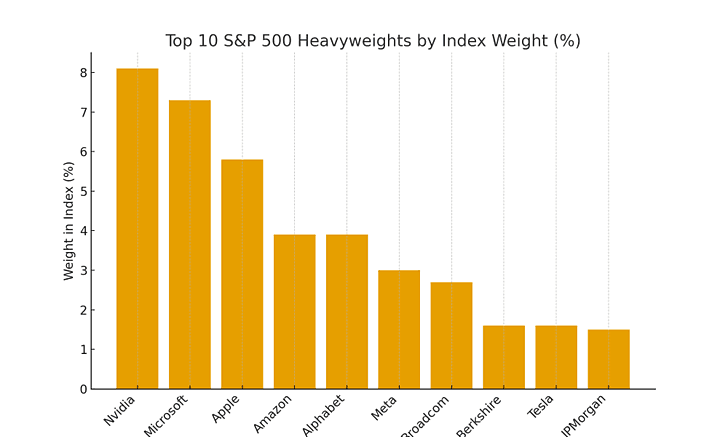
Top Index Constituents
Nvidia (8.1 %)
Microsoft (7.3 %)
Apple (5.8 %)
Amazon (3.9 %)
Alphabet (3.9 %)
Meta Platforms (3.0 %)
Broadcom (2.7 %)
Berkshire Hathaway (1.6 %)
Tesla (1.6 %)
JPMorgan Chase (1.5 %)
These mega-caps heavily influence index moves, especially in highly-weighted sectors such as semiconductors, tech, and consumer services.
Looking Ahead: Shortened Trading Week
This week begins with Monday off for a market holiday, truncating the usual five-day cycle. Given the recent volatility, investors will likely tune in for updates on inflation, employment, and further earnings - especially from tech and industrial sectors.
Outlook
The S&P 500 was nearly unchanged for the week but gained 1.90% in August. Index heavyweights such as Nvidia, Microsoft, and Apple continued to drive performance. This week investors will closely watch upcoming macroeconomic data and earnings announcements to gauge short-term direction.
Trading Perspective
We will see tomorrow if the current uptrend continues. My model’s High Time Frame (HTF) using daily data has the current BUY trend as 6-days old and weakening. If the market continues to soften, then we would look to SELL short using the Low Time Frame (LTF) with chart bars of 1-minute, 2-minute and 5-minute, 15-mintue and 5/20 and 10/40 SMA crosses.
Conversely, if the uptrend stays intact, look to BUY long using chart bars of 1-minute, 2-minute and 5-minute with the same SMA crosses, 5/20 and 10/40.
by Peter B. Levant, MBA, MSc Finance, Managing Director, Index Research LLC
Weekly Reports
/
Smart market insights
Want us to cover a specific topic?
Whether it’s a sector, company, or macro theme you'd like to see explored — tell us. We continuously refine our research based on member input.