Weekly Newletter #45
Ads
S&P 500 Hits New Highs as Fed Begins Rate-Cutting Cycle
The U.S. equity market delivered another strong week, with the S&P 500 index climbing to fresh record highs following the Federal Reserve’s long-anticipated decision to cut interest rates by 25 basis points. While the cut had been broadly priced in, investors quickly shifted toward the trajectory of the easing cycle - how fast and how deep the Fed will move. Despite warnings from some analysts that valuations are stretched, market action suggests the uptrend remains intact. Importantly, leadership showed signs of broadening beyond large-cap technology, with small-cap stocks participating in the rally. Below is a day-by-day breakdown of the week’s market action, followed by forward-looking insights.
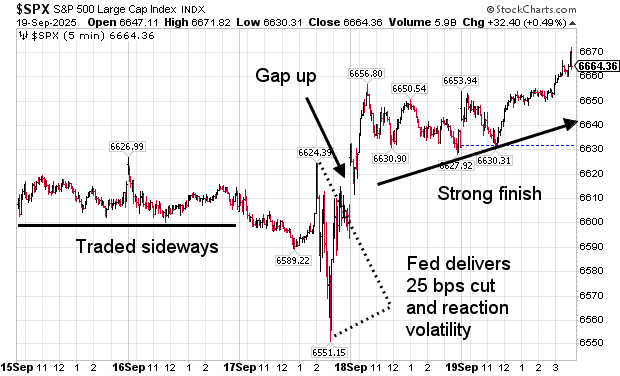
chart courtesy of stockcharts.com
Monday: Market traded sideways
The week began with cautious optimism. Investors entered Monday already expecting the Fed to deliver a quarter-point rate cut mid-week. Market positioning reflected this consensus: futures markets priced nearly a 100% probability of the move, while also projecting multiple cuts through year-end.
Tuesday: Caution Ahead of the Fed
Tuesday’s session was subdued as traders braced for the Fed’s policy decision. The S&P 500 traded in a narrow range, with volumes lighter than average. Investors avoided aggressive positioning. Still, there were encouraging developments beneath the surface. The Russell 2000 small-cap index advanced, continuing a recent run of strength. This rotation hinted that investors are looking beyond the mega-cap technology names that have dominated the rally. Energy stocks also outperformed, helped by firming oil prices.
Wednesday: The Fed Delivers
All eyes were on the Federal Reserve. As expected, the central bank cut the federal funds rate by 25 basis points, the first reduction of the current cycle. The statement acknowledged cooling inflation and highlighted concerns over slowing job growth, signaling that the Fed is prepared to support the economy with additional easing.
After the reaction volatility subsided, the S&P 500 surged to a new closing high, led by gains in technology, consumer discretionary, and industrials. Financial stocks also rallied as lower rates reduce recession risk, which could bolster credit demand. Bond yields fell sharply, confirming the market’s view that the easing cycle is now underway.
Thursday: Follow-Through Buying
The momentum continued into Thursday. Investors digested the Fed’s decision and Powell’s relatively dovish tone, interpreting it as the beginning of a gradual but persistent cutting cycle. Futures markets priced in the possibility of three more cuts by mid-2026, though debate remains about the exact path forward.
Friday: Strong Finish to the Week
Friday capped the week with another positive session. Financials, industrials, and small caps showed leadership, a development market bulls have long awaited. By the close, the S&P 500 had notched its best weekly performance in two months.
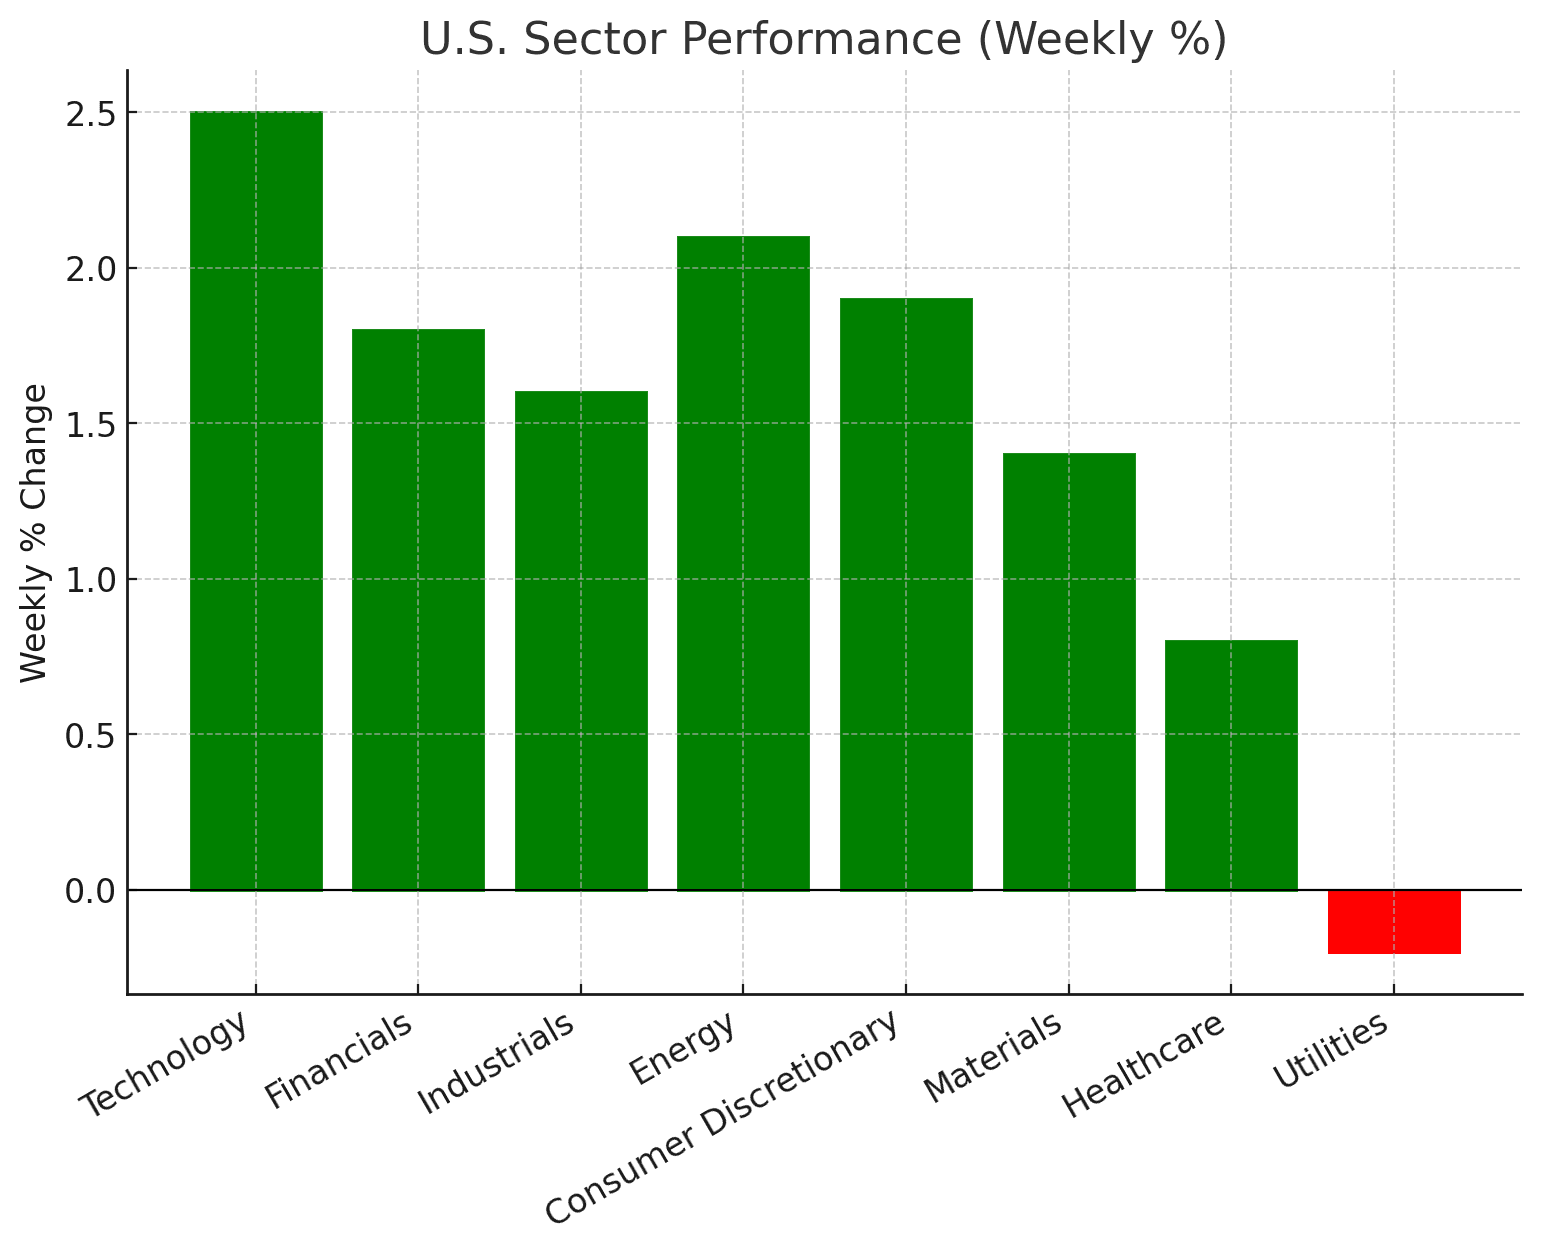
S&P 500: Rally Broadens Beyond Technology Leadership
For much of the past year, the rally has been dominated by technology companies, particularly in artificial intelligence, cloud computing, and semiconductor industries. These firms remain the primary engine of market performance, contributing a significant share of index gains.
However, recent trading sessions have signaled a healthy broadening of participation. Investors are beginning to rotate into sectors that have lagged, including financials, industrials, and consumer discretionary. This shift suggests that market momentum is no longer confined to a handful of mega-cap tech leaders, but is instead drawing strength from a wider range of industries.
Small-cap equities, often seen as a barometer of risk appetite, have also gained traction, adding another layer of confirmation that market breadth is improving. Stronger performance in energy and materials stocks further reflects confidence in cyclical areas of the economy. These moves indicate that investors are preparing for a more balanced phase of the bull market, where multiple sectors contribute to growth rather than a narrow concentration.
Interest Rate Outlook: How Fast and How Deep?
The Fed’s 25-basis-point cut was no surprise, but the bigger question is the trajectory of the cycle. Powell emphasized that the central bank will remain data-driven. Inflation has eased meaningfully, but remains above the 2% target and labor market indicators are softening, but not collapsing.
Markets currently expect a series of steady, quarter-point cuts stretching into 2026, with the federal funds rate possibly falling by 100 - 125 basis points over the next 12 months. The pace will depend on whether inflation continues to cool and whether the economy slows further.
The Fed faces a balancing act: cutting too quickly risks reigniting inflation, while moving too slowly risks undercutting growth. The consensus view is for a gradual easing path, but investors should remain alert to incoming data that could alter the trajectory.
Market Valuations and Bearish Voices
Despite the positive momentum, not all analysts are convinced. Some argue that equity valuations are stretched, particularly in the technology and AI sectors. With the S&P 500 trading near 21 times forward earnings, multiples are above historical averages.
Skeptics warn that a correction could occur if earnings fail to keep pace with lofty expectations. Market veterans caution that concentrated leadership - where a handful of mega-cap tech stocks dominate gains - can leave the market vulnerable to reversals.
Still, recent action offers a counterpoint: the broadening rally into small caps, financials, and cyclicals suggests the market may be gaining healthier underpinnings.
Looking Ahead: Economic Calendar This Week
This week’s calendar offers several data points that could shape Fed expectations:
New Home Sales
Durable Goods Orders
GDP Gross Domestic Product Q2
Initial Jobless Claims
Core PCE
Consumer Sentiment
Beyond the data, several Fed officials are scheduled to speak, which could further clarify the central bank’s stance following this week’s cut.
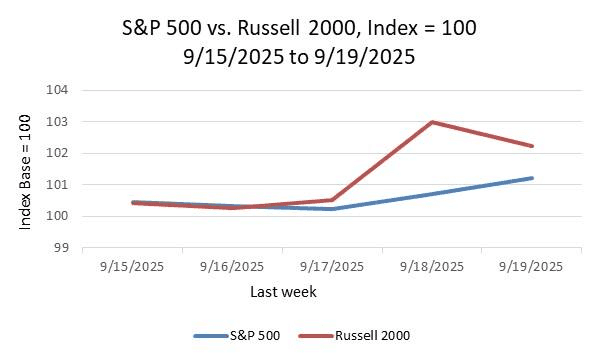
Russell 2000 small-cap index outperformed the S&P 500
Last week, the Russell 2000 surged more than the S&P 500.
This outperformance is often viewed as a positive sign for market breadth. When smaller, more domestically focused companies join the rally, it suggests investor confidence is broadening beyond a narrow set of mega-cap leaders. That improves the sustainability of the uptrend, as participation widens across sectors and market capitalizations.
The trigger was the Federal Reserve’s decision to cut interest rates by 25 basis points. Lower rates ease financial conditions, which disproportionately benefit small-cap firms reliant on borrowing. For many analysts, this confirms that Fed easing can support not just Wall Street’s giants, but also Main Street’s companies.
Conclusion: Uptrend Intact, Breadth Improving
The U.S. stock market closed the week with a decisive message: the uptrend is intact, the S&P 500 is at new highs, and breadth is improving. While valuations remain a legitimate concern, the combination of Fed support and broadening participation beyond technology suggests the bull market retains momentum.
The path forward will hinge on the Fed’s easing trajectory and incoming economic data. Investors should remain nimble, balancing the opportunities of a broadening rally with the risks of high valuations. For now, however, the message from market prices is clear: buyers remain in control.
Trading Perspective
This was a notable week. The long-anticipated Fed rate cut finally arrived, and while the reaction was positive, it was measured. The 25 bps reduction had already been priced in, and Friday’s close was firm without being euphoric.
I don’t often focus on money flows, as it’s unclear whether they lead or lag. Still, the week leading into the cut stood out: investors poured $57.7 billion into U.S. equities - the largest inflow since December 2024. With lingering risks such as sticky inflation, a softening job market, and uncertainty around the pace of further cuts, this surge feels a bit stretched.
My High Time Frame (HTF) model, based on daily data, shows a BUY trend that is twelve days old with medium strength. From a short-term trend-following perspective, the trend is mature but still supportive of continuation. In this environment, however, I remain open to both long and short setups.
On the Low Time Frame (LTF), the signals are mixed:
BUY on 2- and 5-minute bars, using upward crossovers in the 5/20 and 10/40 SMAs.
SELL on 2-, 5- and 15-minute bars, using downward crossovers in the 10/40 SMAs.
It’s best to confirm crossovers with several bars before acting. I focus on high-liquidity periods, such as the day session open and I’ll continue to monitor $SPX S&P 500 index cash market gaps as signals for intraday opportunities.
by Peter B. Levant, MBA, MSc Finance, Managing Director, Index Research LLC
Weekly Reports
/
Smart market insights
Want us to cover a specific topic?
Whether it’s a sector, company, or macro theme you'd like to see explored — tell us. We continuously refine our research based on member input.