Weekly Newletter #47
Ads
Record Highs Across the Board!
The final week of September and the first trading days of October brought a wave of optimism to U.S. financial markets. The S&P 500 hit a new record high, propelled once again by strength in technology and artificial-intelligence stocks. Nvidia (NVDA) led the charge, breaking to a fresh all-time high despite a partial government shutdown that, in earlier cycles, might have dampened sentiment. The market seemed determined to look past politics and focus on growth and innovation.
Meanwhile, gold and Bitcoin each reached new highs of their own - an unusual trio of rallies that underscores the diversity of this market’s drivers. Gold’s advance reflects a combination of falling real interest rates and renewed demand for inflation hedges. Bitcoin’s breakout, on the other hand, continues to highlight structural buying from institutions and long-term holders in an asset with permanently limited supply. Together, these trends show that capital continues to flow into risk-sensitive and alternative assets alike.
Despite widespread acknowledgment that valuations are stretched, the macro backdrop remains supportive. Major equity corrections historically occur when interest rates are rising, not falling - and today, yields are drifting lower as the Federal Reserve enters an easing phase. In that environment, the S&P 500 could very well continue to grind higher.
Please see below one week S&P 500 chart with 5-minute bars.
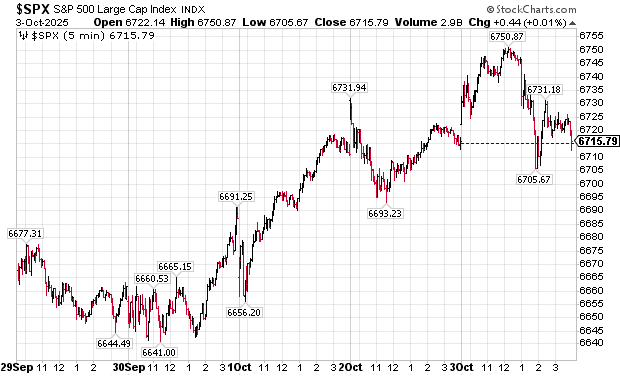
chart courtesy of stockcharts.com
Day-by-Day Summary
Monday, September 29: Solid Start
The S&P 500 opened on a strong note, supported by strength in technology stocks. Investor sentiment remained broadly positive.
Tuesday, September 30: Caution Emerges
Markets paused on Tuesday. Selling was orderly, and defensive rotation into healthcare and consumer staples helped limit losses. Prices recovered into the close.
Wednesday, October 1: Recovery Builds
By midweek, buying resumed. Ongoing enthusiasm for AI lifted technology shares, with Nvidia gaining notable momentum.
Thursday, October 2: Consolidation
Thursday was more balanced. Although the government shutdown stayed in the headlines, the market took it in stride. Overall sentiment remained constructive.
Friday, October 3: Record High
The week ended with the S&P 500 touching a new all-time high. Nvidia also hit a record as investors looked past policy concerns and favored continued momentum.
Technology and AI Power the Rally
The leadership story has not changed: mega-cap technology and AI-related stocks continue to drive the market. Nvidia remains the poster child for this trend. The company’s position at the center of the AI hardware ecosystem has made it a proxy for the broader enthusiasm around artificial intelligence, machine learning, and data infrastructure.
Nvidia’s new record high last week underscores the depth of demand for exposure to the AI theme. Each pullback over the past several months has been met with buyers, reflecting the market’s conviction that AI will remain a secular growth driver well into the next decade. The Nasdaq outperformed again, and the S&P 500’s breakout owes much to tech’s continued strength.
Gold jumps again
At the same time, gold joined the party. The precious metal rallied to a new high above previous resistance, supported by easing Treasury yields and a weaker dollar. Investors appear to be rediscovering gold as a hedge - not against inflation per se, but against uncertainty and excessive optimism in other asset classes.
Gold’s strength alongside equities is not typical, but it fits the current environment: liquidity remains abundant, the Fed is tilting dovish, and global investors are diversifying their holdings. In that sense, gold’s rise confirms rather than contradicts the bullish sentiment across markets. Please see below six month gold chart with daily bars.
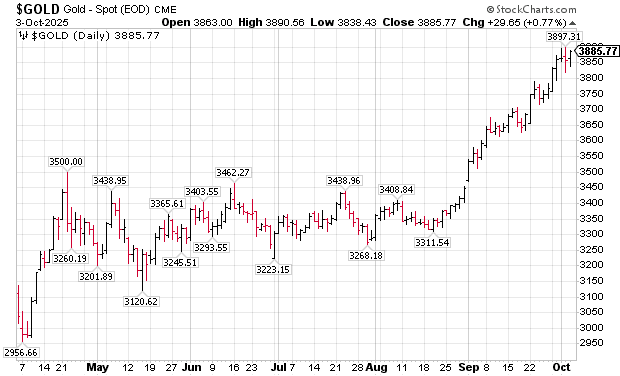
chart courtesy of stockcharts.com
Bitcoin Breaks Out
Perhaps the most intriguing move of the week came from Bitcoin. The cryptocurrency broke to a new high, adding to an already impressive year-to-date rally. Bitcoin’s structure remains strong: its supply is fixed, its ownership increasingly institutional, and its price discovery global.
When Bitcoin breaks out to the upside, there is no technical resistance - only potential profit-taking. The absence of natural supply on rallies can make upward moves sharp and self-reinforcing.
Valuing Bitcoin is inherently difficult. Should it be worth $50,000, $100,000, $500,000, or even $1 million? That uncertainty - ironically - makes it easier for the price to rise, because there is no universally accepted “fair value” to cap enthusiasm. In 2025, the “digital gold” narrative has gained renewed traction, with Bitcoin joining AI and gold as symbols of both innovation and scarcity. Please see below one week Bitcoin chart with 30-minute bars.
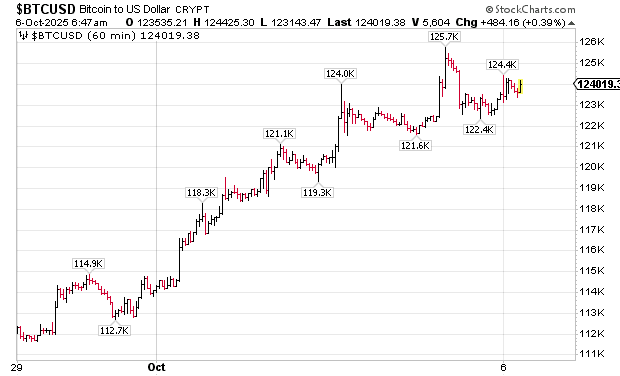
chart courtesy of stockcharts.com
The Broader Picture
This is an unusual moment in markets. Risk assets across categories - equities, crypto, even gold - are simultaneously making new highs. By traditional valuation metrics, many would appear overextended. Yet the Fed’s rate-cutting cycle is providing powerful tailwinds.
Lower rates increase the present value of future cash flows, supporting equity valuations. They also encourage investors to seek returns in growth assets rather than in fixed income. The result is an environment where stretched multiples can persist longer than skeptics expect.
Historically, major bear markets have begun when interest rates are rising sharply, compressing valuations and tightening financial conditions. That is not the case today. With rates easing, liquidity plentiful, and inflation under control, markets continue to climb the proverbial wall of worry.
Risks to the Rally
While the backdrop for equities and other risk assets remains broadly supportive, it’s worth remembering that even the strongest rallies can be interrupted. Several factors could derail the current advance. The most immediate would be a policy mistake- for example, if the Federal Reserve were to abruptly pause or slow its rate-cutting cycle. Such a shift could quickly tighten liquidity and trigger a repricing of risk across both stocks and bonds. Markets have expectations of an easier monetary stance. If that changes, investors could find themselves adjusting sharply to a less accommodative outlook.
Exogenous risks also loom in the background. Geopolitical tensions, unexpected regulatory actions, or a sudden escalation in trade friction could easily unsettle sentiment. Although I do not expect it, there is the possibility of another round of aggressive U.S. tariffs on major trading partners. This would complicate global supply chains and potentially reignite inflationary concerns, undermining the very rationale for lower rates.
Finally, markets must contend with their own success. Extended rallies often invite complacency and overconfidence, with investors assuming that momentum will simply continue. History shows that major corrections rarely begin amid fear - they begin when optimism peaks. For now, the path of least resistance remains up, but staying aware of these potential headwinds is essential.
How it looks right now
The first week of October ended with a clean sweep of record highs: the S&P 500, gold, and Bitcoin all advanced to new peaks. Nvidia’s performance reaffirmed the strength of the AI theme, and falling interest rates continue to support higher valuations.
Yes, markets look expensive by old standards - but old standards don’t necessarily apply in a world of declining yields, rapid technological change, and structural demand for scarce assets. As the saying goes, “high can always go higher.” At record levels, there is no resistance; prices can move through prior ceilings like a hot knife through butter.
For now, momentum remains the dominant force.
Trading Perspective
The old adage, “the trend is your friend,” has stood the test of time for a reason. Market trends often persist longer than most expect, and prices can travel well beyond initial trader or investor projections. Recognizing and aligning with these sustained moves remains one of the most effective principles in trading.
My short-term high-time-frame (HTF) model, which analyzes daily data, currently identifies the S&P 500 uptrend as six days old with medium strength. The moves higher have been steady rather than explosive - prices are grinding upward, not spiking - as of the writing of this report, the path of least resistance remains to the upside.
On the low-time-frame (LTF):
BUY: 2- and 5-minute bars, triggered by upward 5/20 SMA crossovers and then an SMA bounce.
by Peter B. Levant, MBA, MSc Finance, Managing Director, Index Research LLC
Weekly Reports
/
Smart market insights
Want us to cover a specific topic?
Whether it’s a sector, company, or macro theme you'd like to see explored — tell us. We continuously refine our research based on member input.