Weekly Newletter #49
Ads
S&P 500 Holds Firm Amid Broad Trading Range and Fed Reassurance
The week of October 13 - 17 turned out to be more about digestion than direction. After the prior Friday’s sharp selloff, many investors braced for deeper trouble, yet the week unfolded with resilience instead of panic. Stocks steadied, gold’s record-setting rally cooled off, oil stayed under pressure, and a slightly dovish Federal Reserve tone helped the market regain its footing. It was a week of push and pull - the market bent, but it didn’t break.
Equities - S&P 500 Holds Firm Amid Cross Currents
The S&P 500 finished the week modestly higher, closing Friday up 0.53% at 6,664, regaining some of the ground lost earlier in the month. Financials and chipmakers provided leadership, thanks to encouraging quarterly results from Morgan Stanley, Bank of America, and several large-cap tech names.
Throughout the week, the index traded in a wide, roughly 150-point range, reflecting a market digesting a complex mix of cross currents - optimism about potential Fed rate cuts on one side, and concern about lofty valuations and uneven growth on the other. This was not a calm, contained range; it was an active one. Several big microtrends played out within the week - directional bursts lasting a few hours - as traders responded to shifting intraday flows, news headlines, and changing expectations.
For instance, Tuesday (Oct 14) had a strong rally, while Thursday (Oct 16) had the opposite. These reversals defined the character of the week. Short-term momentum traders found opportunities in both directions, while longer-term investors mostly watched and waited.
It’s fair to say the S&P 500 is digesting the push and pull of multiple forces. On one side, optimism about easing policy supports risk appetite. On the other hand, stretched valuations and earnings concerns temper enthusiasm. Many of the market’s top stocks - particularly in technology and growth - are richly priced, and the question “what’s the right price for these businesses?” hangs over every rally. For now, investors appear willing to give them time to prove themselves, but patience isn’t infinite.
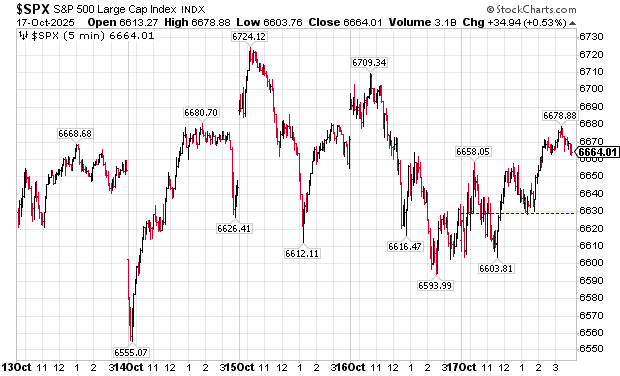
chart courtesy of stockcharts.com
Gold & Silver - A Record Run Meets a Pause
Gold and silver were again front and center. Early in the week, gold surged past $4,300 per ounce, setting fresh all-time highs, while silver climbed above $52 per ounce. Those moves were fueled by strong physical demand, central-bank buying, and a growing shift toward tangible assets.
However, by Friday, both metals dropped as traders took profits and momentum cooled. Gold fell 1.80%, closing at $4,250, while silver slid 2.32% to $51.88.
The Friday decline looked less like a reversal and more like a natural breather after an intense rally.
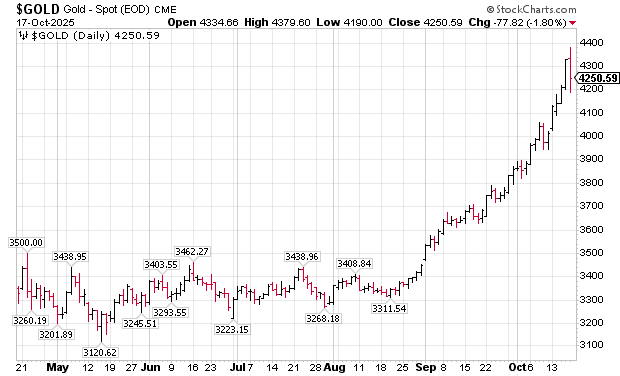
chart courtesy of stockcharts.com
Even after the pullback, the broader uptrend remains intact. The factors driving it - a weaker dollar, geopolitical uncertainty, and institutional accumulation - are still present. What’s changed is positioning: after such a powerful move, the market needed to shake out short-term speculators. The much-talked-about $5,000 gold target still feels ambitious, but not implausible if demand stays strong. For now, a brief consolidation could reset momentum and set the stage for another advance later in the quarter.
Oil - Weak Tone Persists
Oil remained the laggard. WTI crude settled Friday at $57.64 per barrel, down from $59 earlier in the week, while Brent closed at $61.33. The market continued to face a trio of headwinds: rising inventories, steady U.S. production, and fading demand expectations from Europe and Asia.
This marked oil’s third straight weekly decline, underscoring how sentiment has shifted from supply fears to demand doubts. Even though OPEC+ remains publicly committed to production discipline, traders see little near-term catalyst to spark a rebound. Many analysts point to technical support around the mid-$55 area. Until economic data or geopolitics turn, oil may stay range-bound with a downward bias.
The Fed - Dovish Tone, Familiar Message
Federal Reserve Chair Jerome Powell struck a mildly dovish tone, repeating that the trajectory of monetary policy has not changed. The Fed continues to see inflation moderating gradually while keeping options open for future cuts. That message comforted markets without surprising them.
According to CME FedWatch, traders still expect two quarter-point rate cuts in 2025, likely split between the next two meetings. Because those cuts are already priced in, the market’s reaction was muted - investors want to see confirmation in the data before committing new capital. In other words, dovish talk alone is not enough to drive the market to new highs.
Themes & Takeaways
1. Digestive phase continues – The S&P 500 isn’t trending strongly; it’s absorbing the push and pull of multiple cross currents.
2. Microtrend trading – Fast intraday reversals remain common, creating a trader’s market even when daily closes seem uneventful.
3. Gold and silver pause – After setting records, metals cooled as profit-taking kicked in. The trend remains bullish but extended.
4. Oil stays heavy – Oversupply and weaker demand expectations weigh on prices, with technical support near $55.
5. Fed outlook priced in – With two cuts already expected, markets need fresh data - not just dovish tone - to move higher.
Final Thoughts
When the dust settled on Friday, the week looked far better than it began. The S&P 500 held up, even while digesting a wide trading range and competing narratives. Gold and silver cooled off, but their momentum remains impressive. Oil remained weak, reflecting persistent caution about global growth. And the Fed’s steady tone gave markets enough reassurance to stay calm without igniting euphoria.
It was a week defined by adjustment - a recalibration of expectations rather than a change in direction. The cross currents between optimism and realism remain strong, and the market continues to find its balance between the two.
For traders, the volatility within the range has created fertile ground for short-term opportunity. For investors, the message is patience: the longer the digestion lasts, the more meaningful the next move may become.
The market neither soared nor sank, but it absorbed a lot - new data, new Fed signals, and another test of sentiment. In a year where resilience counts for as much as returns, simply holding steady through turbulence is a quiet victory.
Trading Perspective
Friday’s recovery was technically important.
The trading range held, and the market did not break major support levels. After the intense selling that closed the previous week, this one brought a welcome sense of relief.
Looking ahead to next week, I expect more of the same type of action.
However, keep in mind that an unexpected or exogenous event could easily unsettle a market that’s still trying to find direction. I’ll remain nimble and continue focusing on microtrends.
My High-Time-Frame (HTF) model, which analyzes daily data, remains in SELL mode. The trend is six days old but very weak - essentially neutral at this stage.
On the Low-Time-Frame (LTF):
• BUY: 5- and 15-minute bars triggered by upward 5/20 SMA crossovers followed by an SMA bounce.
• SELL: 5- and 15-minute bars triggered by downward 5/20 SMA crossovers followed by an SMA bounce.
by Peter B. Levant, MBA, MSc Finance, Managing Director, Index Research LLC
Weekly Reports
/
Smart market insights
Want us to cover a specific topic?
Whether it’s a sector, company, or macro theme you'd like to see explored — tell us. We continuously refine our research based on member input.